Latest 
 Career Development Denise Alexander
Recent Blog Posts


Most students are familiar with the Microsoft Office Suite, which includes applications such as Word, PowerPoint and Excel. Proficiency in all of these applications is essential to your success as a student and in your future career. This blog is part of a series about relatively easy ways you can get more out of Microsoft Office.
Excel is one of the most useful tools in the Microsoft Office Suite. People use Excel to store, organize and analyze data, as well as create customized charts and graphs. With hundreds of functions and styles, Excel is a powerful tool that can be used for a variety of personal, professional and academic projects.
When people think of Excel, they might think of it as an accounting tool, one with lots of complex formulas and functions. Actually, most people use Excel to keep track of lists of data. Even though this is the most popular use for Excel, there is an excellent feature for data tracking that often goes overlooked.
Entering in lists of data is a simple way to keep track of everything from small business expenses to the office Secret Santa exchange. But working with that data can be a pain if you don’t turn it into a table. Luckily, this is very easy to do.
Follow this step-by-step process to create a table in Excel:
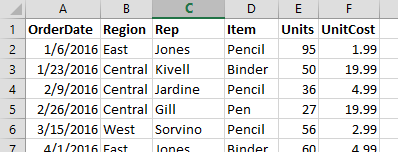
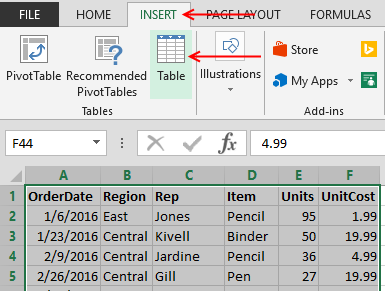
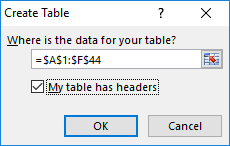
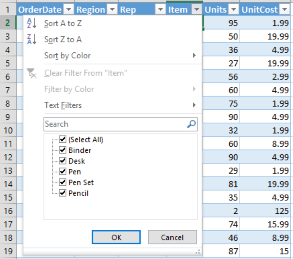
And that’s it--your list of data is now sortable and filterable! To view a specific set of data, just click the small arrow next to the column that you want to sort or filter. This function allows you to quickly find details about your data that you may not have otherwise noticed.
When you filter your data, Excel doesn’t delete lines (though it looks like it does). Instead, it hides the rows that don’t match the filter so that you can see only the information you’re most interested in viewing. But, as soon as you remove the filter, all those rows come right back and you are able to view your full list of data.
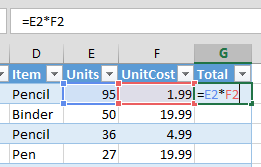
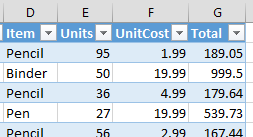
Excel is an intuitive and user-friendly tool. For example, if you add a new formula next to the table, Excel will assume that you want to apply that formula to other cells in the table. Excel will then automatically add the formula to the entire table, as appropriate. This saves you valuable time since you do not have to copy and paste the formula in each cell for the entire column.
You can also adjust the formatting of the entire table by going to the Table Design tab and choosing a color and font theme that fits your needs.
Excel is an easy to use and will help you keep track of just about anything, from finances to fantasy football, from grades to graduation—and using Tables makes it even easier! Following these tips will help you get started on creating helpful tables at work, at school and at home.
BLS pay estimates calculate the median annual wage for various occupations. Per the BLS the median wage for an occupation is: "The wage at which half of the workers in the occupation earned more than that amount, and half earned less. Median wage data are from the BLS Occupational Employment and Wage Statistics survey." Bureau of Labor Statistics (BLS), U.S. Department of Labor, Occupational Outlook Handbook 2024. BLS median wage estimates do not represent entry-level wages and/or salaries. Multiple factors, including prior experience, age, geographic market in which you want to work, and degree level and field, will affect career outcomes, including starting salary and earnings as an experienced employee. Herzing neither represents that its graduates will earn the median salaries calculated by BLS for a particular job nor guarantees that graduation from its program will result in a job, promotion, particular wage or salary, or other career growth.
Get the latest news you need to know, from study hacks to interview tips to career advancement. Have it delivered right to your inbox biweekly.